
MEDIA
Election victory and loss margins show a luckier Congress than BJP
www.livemint.com | June 13, 2024An analysis of Lok Sabha results shows that the Congress had close calls in its wins and the BJP had relatively narrow losses
Soren Kierkergaard, the 19th century Danish religious philosopher once said: “Life can only be understood backwards, but it must be loved forwards.” The same could be said about elections. With all kinds of poll predictions going wrong this time (like most of the time, frankly), Indian electoral politics has finally come to terms with the fact that we can understand elections only backwards.
Post-poll analysis has been quite interesting indeed. The focus, however, has been on the victory of winners, and not as much on the losses of those who couldn’t win. In an electoral democracy with a first-past-the-post (FPTP) system, understanding how much one loses by is equally important to understand what really happened. Elections are numerically always about who is liked by the most, and not about who is disliked by the least (the two are not the same, except when there are only two contestants). Similarly, liked by most is not always equivalent to most liked (think about the distance between two preferences).
These variables (least disliked or most liked), even if not captured in a FPTP system, are useful lenses to view election results. They allow us a peep into the minds of voters at the aggregate level and nudge politicians to begin preparing for next elections.
We excavate a very simple metric; in addition to winning margins, we also look at losing margins at the constituency-level to compare the Bharatiya Janata Party (BJP) with the Indian National Congress
(INC). For the winning candidate, the margin is decided by her vote share less the vote share of the second-position candidate in that constituency. For the losing candidate (defined as the one in second position or below), the margin is defined by her vote share less the vote share of the winner in that constituency. We plot the distribution of these margins (in percentage points) for the two parties’ winning and losing seats across India.
Winning constituencies are graphed against their winning margin. We do the same for losing constituencies, but with their losing margin. The distributions that are shown tell us, for example, out of all the constituencies where the BJP (or INC) lost, how many constituencies did it lose by 5 percentage points, or 10 percentage points, and so on. As one would guess, the distribution basically explains whether a party is ‘lucky’ or ‘unlucky’ in the results. The results are telling. The BJP overall seems to have lost thinly and won hugely; the INC, on the other hand, has lost hugely and won thinly.
We find that in 26% of the BJP’s losing seats, the losing margin was less than 5 percentage points. For the INC, only 13% of seats had such low margins. In fact, in half of all BJP losing seats (and 25%
of INC seats), the loss margin was less than 10 percentage points. Merely 4.5% of losing seats from BJP while 21% of losing seats for the INC suffered a losing margin of up to 40 percentage points.
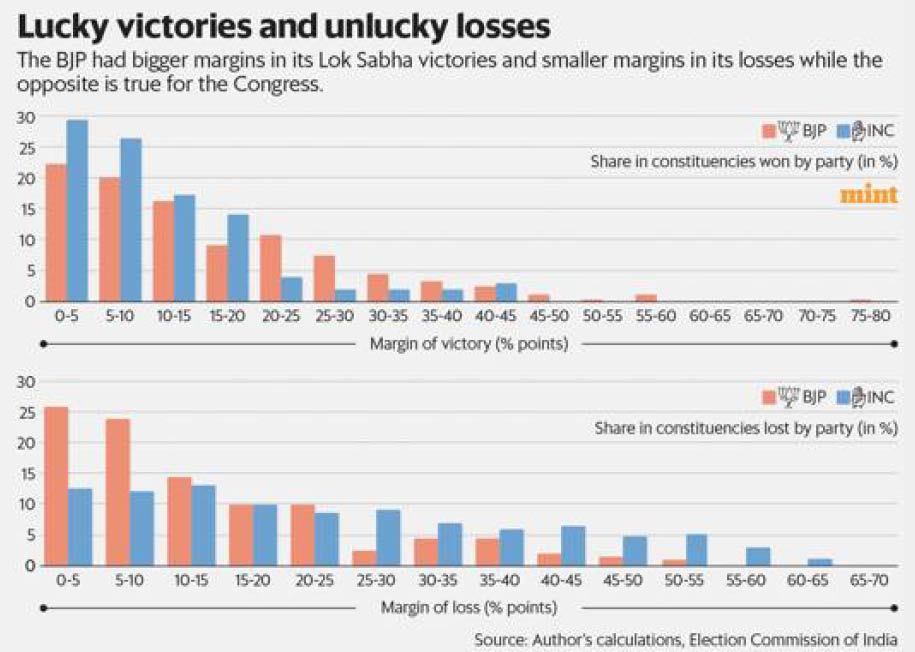
The same story repeats in winning seats. The INC’s winning margin is small on the whole, while the BJP’s is high. For the BJP, 40% of winning seats have a margin less than 10 percentage points, but
56% of INC’s winning constituencies are won within this margin. Just 3% of the INC’s winning seats are won by a margin greater than 40 percentage points, while 6% of the BJP’s clock this margin.
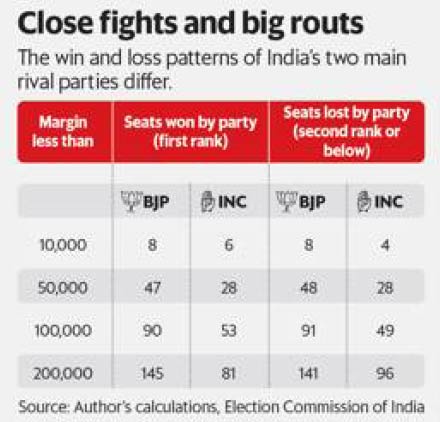
Consider the absolute margins. The BJP lost 48 seats with margins less than 50,000, while the INC lost only 28 under this margin. The two parties lost 91 and 49 seats respectively with margins under
100,000 and 141 and 96 seats with margins under 200,000. In terms of victories, the numbers show similar patterns, with the BJP winning more with large margins and the INC less. BJP won 47 constituencies with margins of up to 50,000, the INC only 28. The two parties secured 90 and 53 seats respectively with margins of up to 100,000 and 145 and 81 seats with margins less than 200,000.
On an aggregate across all constituencies, the average of the BJP’s winning margins is 15.8 percentage points and the INC’s is 11 percentage points (in constituencies they won). The BJP is winning with somewhat larger average margins. We also notice that the BJP is losing with smaller average margins (13.8 percentage points) compared to the INC (23.9 percentage points) in constituencies they lost. Basically, the BJP had more close calls in its losses, while the INC in its wins. This implies that the BJP was unlucky and destiny favoured the INC. This does not mean that the INC should not celebrate. But this indicates the ‘quality’ of wins and losses. The margin distribution tells us whether the BJP should be sad or very sad about its losses and if the INC should be happy or very happy about its wins. These emotional responses do not matter, of course, but what matters are their strategies in upcoming elections.
Authors: Prof. Yugank Goyal, Faculty of Public Policy, and founder director of the Centre for Knowledge Alternatives at FLAME University; and Mahadev P. Menon, student at FLAME University.